Sprint Risk Management
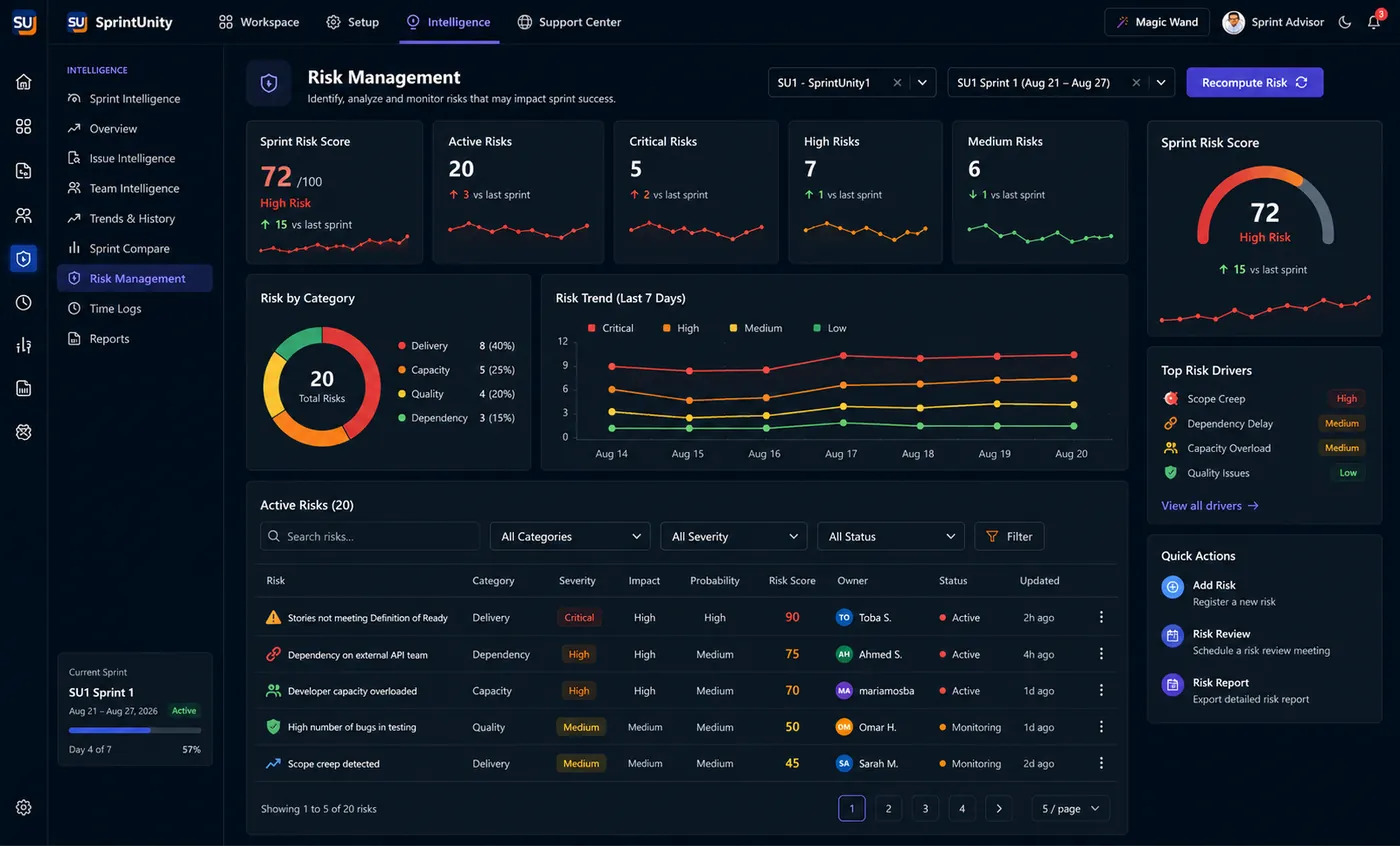
See sprint risks before they become blockers. Delivery, capacity, quality and dependency risks are identified, scored and tracked against one consolidated Sprint Risk Score — while the sprint is still recoverable, not after it's already slipped.
The 3 tabs, in depth
1. Dashboard — the current risk picture
The landing tab for a selected project and sprint. An Overall Sprint Risk card shows the 0–100 score on a colored ring, its level (Low/Medium/High/Critical), the change versus the previous sprint, a short trend sparkline across up to five sprints, and a Critical/High/Medium/Open-risk breakdown. Next to it, Risk by Category is a donut across Capacity, Delivery, Quality, DOR and Dependency, with a callout naming whichever category is driving 30% or more of total risks. A Risk Indicators panel lists all 10 sprint-level rules with an OK/severity badge for each. A Sprint Health Summary panel totals risks by severity and status (open, monitoring, resolved) with its own mini trend line. Below that, a Top Risks table lists the 5 highest-scoring open risks — click through to full details, or resolve straight from the row menu. A What Needs Attention? banner and card row surfaces the single worst instance of every currently-active rule, automated or manual, so you never have to scan the full register just to see what's on fire.
2. Risk Register — every risk, filterable
The full list. Filter by Category, Severity, Source (Automated or Manual), Status (Open/Monitoring/Resolved), or search by title; results paginate 15 at a time. Each row shows Category, Source, Severity, Score, Status, linked issue (if any), and last-updated date — click any row to open full details. Anyone with the RiskManagement.Create permission sees a + Register Risk button here to add a manual risk directly from the dashboard, in addition to the issue-panel flow covered below.
3. Setup — rules, posture and live preview
Not a metrics dashboard — this is where the detection rules themselves live. A Risk Areas list on the left groups all 17 rules into 6 areas (Delivery, Capacity, Quality, DOR, Dependency, and a currently-empty "Custom" area — rule authoring isn't available yet in this version, detection ships built-in). Selecting an area shows its Detection Rules: each rule's name, plain-language description, current worst severity if triggered, a live "Triggered on N issues" / "Not currently triggered" line, and — for anyone with the RiskManagement.Edit permission — an on/off toggle. On the right, a Risk Posture ring repeats the overall score, backed by a per-area bar chart of real open-signal counts (not a fabricated per-area score — see the calculations section below for why), plus a Sprint Risk Summary card with Active Signals/Critical/Attention/Info counts, a shortcut to the Register, and a Refresh Now button for anyone with RiskManagement.View.
Built-in automated detection — the 17 rules
Analysis doesn't re-run on every page load — only if at least 5 minutes have passed since the sprint's last run, unless someone explicitly clicks Analyze Sprint Risks. A rule that doesn't cross even its lowest threshold produces no risk row at all: the engine only ever creates or updates a row for a condition that's actually present. Ten rules evaluate once per sprint as a whole; seven evaluate per individual issue and can produce several simultaneously active rows — one per triggering issue.
Sprint-level rules (10)
| Rule | Category | Triggers when… |
|---|---|---|
| Capacity Risk | Capacity | Dev or QA hours used reach 70% or more of the sprint's configured max capacity (85% = High, 100% = Critical). |
| DOR Risk | DOR | 10% or more of sprint issues fail Definition of Ready (25% = High, 40% = Critical). |
| Delivery Risk | Delivery | Remaining story points % exceeds remaining sprint time % by 5 or more points. |
| Capacity Underburn | Capacity | Remaining estimated hours % exceeds remaining sprint time % by 5 or more points, based on logged time. |
| Bus Factor Risk | Capacity | One contributor holds 50% or more of committed story points, across 3+ contributors (65% = High, 80% = Critical). |
| High Priority Concentration | Delivery | 40% or more of sprint issues are High or Highest priority. |
| Estimation Drift | Delivery | Actual logged time varies 15% or more from the estimate. |
| Bug-Heavy Sprint | Quality | 20% or more of sprint issues are bugs. |
| Quality / Rework Risk | Quality | 5% or more of sprint issues have been reopened at least once (10% = High, 20% = Critical). |
| Sustained Blocked Share | Dependency | 10% or more of sprint issues are currently blocked. |
Issue-level rules (7)
| Rule | Category | Triggers when… |
|---|---|---|
| Budget Overrun | Capacity | Issue's logged time exceeds its estimate by 30% or more, and it isn't done. |
| Aging Issue | Delivery | Issue has stayed in the same status for 5 or more days (10 = High, 20 = Critical). |
| Stuck in Blocked | Dependency | Issue has been blocked for 2 or more days. |
| Cycle Time Outlier | Delivery | In-progress time already reaches 100% or more of this sprint's typical (P90) cycle time. |
| Status Thrashing | Quality | Issue has moved between statuses 6 or more times (9 = High, 13 = Critical). |
| Unestimated Work in Progress | DOR | Issue is in progress with no dev/QA hour estimate on record. |
| Silent Stall | Delivery | Issue in progress for 3 or more days with no time logged through SprintUnity. |
Benefit to you: every risk's description is generated fresh from your real numbers each time analysis runs — "62% of sprint issues are High or Highest priority" rather than a generic label — so you always know exactly why a risk fired, not just that it did.

Manual risks — added directly from the issue panel
Risk isn't only the system's job to catch. From the Register Risk quick action inside any Jira issue (the same panel developers use for Sprint Issue Vote and Log Time), any team member can flag a risk on the spot: a Title, Category (Capacity/Delivery/Quality/DOR/Dependency/Other), Probability (1 Rare – 5 Almost Certain), Impact (1 Very Low – 5 Critical), a required Mitigation / Action Plan, an Owner, and a Target Date. The score updates live as you pick probability and impact, before you even save. The same + Register Risk form exists on the Risk Register tab in the dashboard app, with two small additions — an initial Status (Open or Monitoring) and a free-text Related Jira Issue field for linking a risk that wasn't raised from the issue itself.

Severity — how probability × impact becomes a score
Manual risks are scored probability (1–5) × impact (1–5), a raw score from 1 to 25:
| Raw score | Severity |
|---|---|
| 16 – 25 | Critical |
| 10 – 15 | High |
| 5 – 9 | Medium |
| 1 – 4 | Low |
Automated risks don't have a probability or impact — they're a condition that crossed a threshold — so each one is assigned a severity directly by its rule (see the threshold tables above), then converted to a flat point value for the Sprint Risk Score: Low = 3, Medium = 9, High = 15, Critical = 20 points. Every currently open or monitoring risk's points are summed and normalized into the 0–100 Sprint Risk Score shown on the Dashboard tab and on Sprint Intelligence & Health — see the calculations section below for the exact formula.
Mitigation, ownership & resolving a risk
Every risk — automated or manual — can carry an Owner and a free-text Mitigation / Action Plan, so a lead can take responsibility for a risk the system detected on its own, not only ones they registered by hand. Opening a risk's details shows its full history as a timeline: every status and value change, who made it, and when — the same audit-trail pattern used across SprintUnity's other history views. Editing a risk (RiskManagement.Edit) lets you change its title, description, category, owner, due date, mitigation notes, and — for manual risks only — its probability and impact; automated risks show their triggering rule and score instead, with a note that there's no probability/impact assessment to edit since the system detected them from a real condition, not an estimate.
A risk moves through Open → Monitoring → Resolved (and can move back from Monitoring to Open if it worsens again). Only Open and Monitoring risks count toward the Sprint Risk Score — resolving a risk (RiskManagement.Resolve) removes it from the score immediately while keeping the row itself for history and audit. Automated risks aren't silently deleted the moment their condition clears either: if a rule stops triggering, its existing row stays as-is until someone deliberately resolves it, so a risk's resolution is always a decision a person made, never an automatic side effect of a number moving back under a threshold.
Calculations behind the numbers and charts
Sprint Risk Score (0–100, shown on the ring)
Every open or monitoring risk contributes severity points (Low 3, Medium 9, High 15, Critical 20 — manual risks via probability × impact, automated risks assigned directly by their rule). Points are summed, then normalized against a fixed ceiling of 75 — deliberately chosen as "5 concurrent High risks": Sprint Risk Score = min(100, round(rawScore ÷ 75 × 100)). Bands: 0–25 Low, 26–50 Medium, 51–75 High, 76–100 Critical.
Risk by Category donut
A straight count of currently open/monitoring risks per category (Capacity, Delivery, Quality, DOR, Dependency). The callout below it only calls out a category by name once it's driving 30% or more of the total — below that, risk is considered spread fairly evenly.
Risk Posture bars (Setup tab)
Real open-signal counts per area, scaled against whichever area currently has the most. Deliberately not a per-category 0–100 score — SprintUnity only computes one overall Sprint Risk Score, so this chart shows honest counts rather than inventing a sub-score that doesn't exist anywhere else in the app.
Benefit to you: this score, its bands, and its point values are the exact same ones used for the Risk pillar of Sprint Health and the Quality Score on Team Intelligence — a risk never means one thing on this page and something slightly different elsewhere.
Why "Analyze Sprint Risks" sometimes takes a moment
Recomputing risk for a large sprint can take longer than Jira's Forge platform allows a single request to run (25 seconds). Clicking Analyze Sprint Risks doesn't calculate inline — it queues a background job while the page polls for a fresh result every 4 seconds, for up to about 3 minutes. On every page load, SprintUnity also quietly checks whether it's been 5+ minutes since the last run and re-analyzes automatically in the background, without you needing to click anything, so risk data rarely goes stale on its own.
Ask Sprint Advisor about this
From the Register Risk dialog in the issue panel, "Ask Advisor" answers real questions about that specific issue — including "What is this page?" and "Are there any risks linked to this issue?" — reading the same risk data shown on screen, never a separate estimate. See AI Sprint Assistant for how Sprint Advisor and Magic Wand work across the rest of the app.
Rating this page
Anyone reading this documentation can mark whether it answered their question — no permission required. It only helps the SprintUnity team see which pages need more detail.