Team Performance & Evaluation
Score every team member fairly, on a recurring cycle, by blending two things: real Jira activity and a manager's own weighted judgment. Team Evaluation is where that scoring gets configured, run, reviewed, and exported — nothing here is a single number pulled from thin air, and this page traces every score back to the exact formula that produced it.
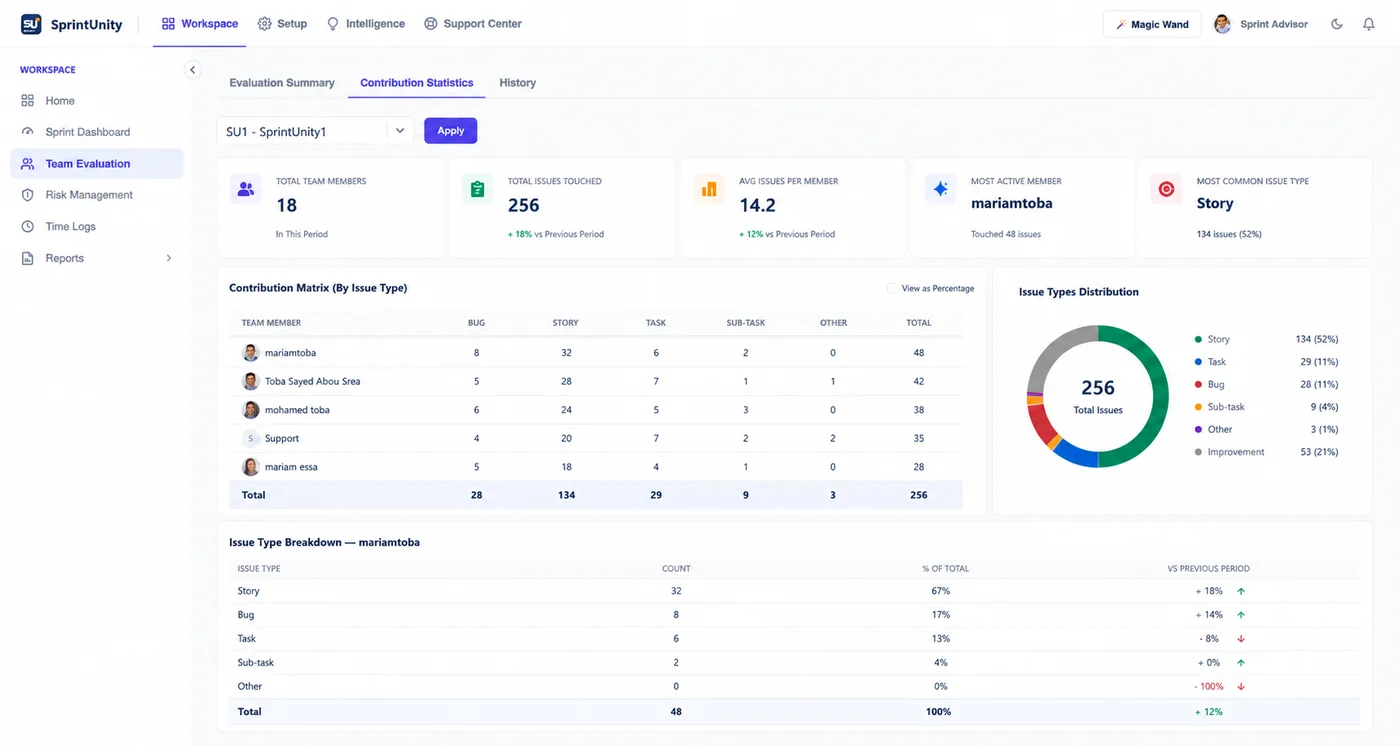
Where Team Evaluation actually lives — two hubs, one shared engine
Team Evaluation isn't one screen — it's split across two hubs that read and write the same underlying data:
Setup → Team Evaluation (configuration)
Three tabs: Evaluation Setup (the 5-step wizard covered below), Evaluation Members (who gets evaluated, by whom, at what seniority), and Evaluation History. This is where the rules get defined.
Workspace → Team Evaluation (results)
Three tabs: Evaluation Summary (run and score the current period), Contribution Statistics (team-wide Jira activity breakdown), and the same Evaluation History component reused from Setup. This is where the rules get applied.
Evaluation History is genuinely the same component in both places — not two similar screens that could drift apart. One history view, reused, exactly like the "single source of truth" pattern used across the rest of SprintUnity.
The 5-step Evaluation Setup Wizard, in depth
Found under Setup → Team Evaluation → Evaluation Setup. Tenant-wide, not per-project — you configure it once and it applies everywhere. Gated by EvaluationSetup.View to see it and EvaluationSetup.Edit to change it.
Step 1 — Evaluation Period
Pick a recurring cycle length: Every 2 Weeks (14 days, recommended), Every 3 Weeks (21 days), or Monthly (30 days). An info bar confirms every evaluation aligns to start from the period's start date, and previews the next period's exact date range.
Step 2 — Roles & Evaluators
A table of all 9 evaluation roles. For each role you set its Evaluator Role (a free-text label — who typically evaluates this role) and its Contribution Ratio (0–100%); the Manual Score Ratio column is always the automatic remainder (100 − Contribution Ratio) and can't be edited directly. The two must always sum to 100% per role.
| Role | Default evaluator |
|---|---|
| Developer | Team Lead |
| Team Lead | Technical Manager |
| DevOps | Technical Manager |
| QA Engineer | QA Manager |
| Business (BA / PO) | BA Manager |
| Manager / Admin Role | Administrator |
| Technical Manager | Administrator |
| QA Manager | Administrator |
| BA Manager | Administrator |
These 9 roles are a fixed catalog — custom roles beyond this list aren't supported yet, since criteria and history are tied to these specific role codes. A newly-configured role defaults to a 50% / 50% Contribution / Manual split until you change it.
Step 3 — Automatic Contribution
Two independent choices that shape what "Contribution" means for everyone:
Which interactions count
7 interaction types are shown as toggles: Created, Reporter, Assignee (Current) — plus Status Transition, Comment, Linked Issue, and SprintVote Vote. Only the first 3 actually feed real counted data today; the other 4 are visible in the design but not yet counted — an honest gap the app surfaces rather than hides, both in this step's own summary text and below.
Which issue types are included
Defaults to the 5 standard Jira types (Bug, Epic, Story, Task, Sub-task). A "Manage Issue Types" dialog lets you select all, clear all, reset to standard-only, or hand-pick custom types your project uses — nothing is counted for a type that isn't included here.
This step doesn't set anyone's actual Contribution Score — it only decides what data the "Fetch Contribution Data" button (used later, during scoring) is allowed to count. See "How Contribution Score is actually set" below for why this distinction matters.
Step 4 — Manual Criteria
Pick a role from the left-hand list, then edit its criteria table: Criteria name, an optional Description, and a Weight (%) per row. Add or delete rows freely (EvaluationSetup.EditCriteria / EvaluationSetup.DeleteCriteria), or click Load Standard Criteria to instantly load SprintUnity's 10 built-in default criteria for that role. Every role's criteria weights must sum to exactly 100% before the setup is usable.
Every one of the 9 roles ships with the same 10-criterion default template (only the wording changes to fit the role) — weights: 15%, 15%, 15%, 10%, 10%, 10%, 5%, 5%, 5%, and a final 10% "Overall Performance" catch-all. For example, the Developer default set is Technical Knowledge (15%), Code Quality (15%), Problem Solving (15%), Team Collaboration (10%), Communication (10%), Ownership (10%), Initiative (5%), Learning & Improvement (5%), Time Management (5%), Overall Performance (10%).
Step 5 — Review & Save
A full summary before saving: 4 cards (Evaluation Period, Roles & Evaluators, Automatic Contribution, Manual Criteria), a plain-language "What This Setup Means" explanation generated from your actual configuration (not canned text), a Scoring Formula box with a donut chart of the average Contribution/Manual split across all roles, and an Export Summary button that downloads a plain-text recap of the whole configuration.
Final Score = (Automatic Score × Contribution Ratio) + (Manual Score × Manual Score Ratio) — the exact same formula the backend uses to compute every real score, word for word.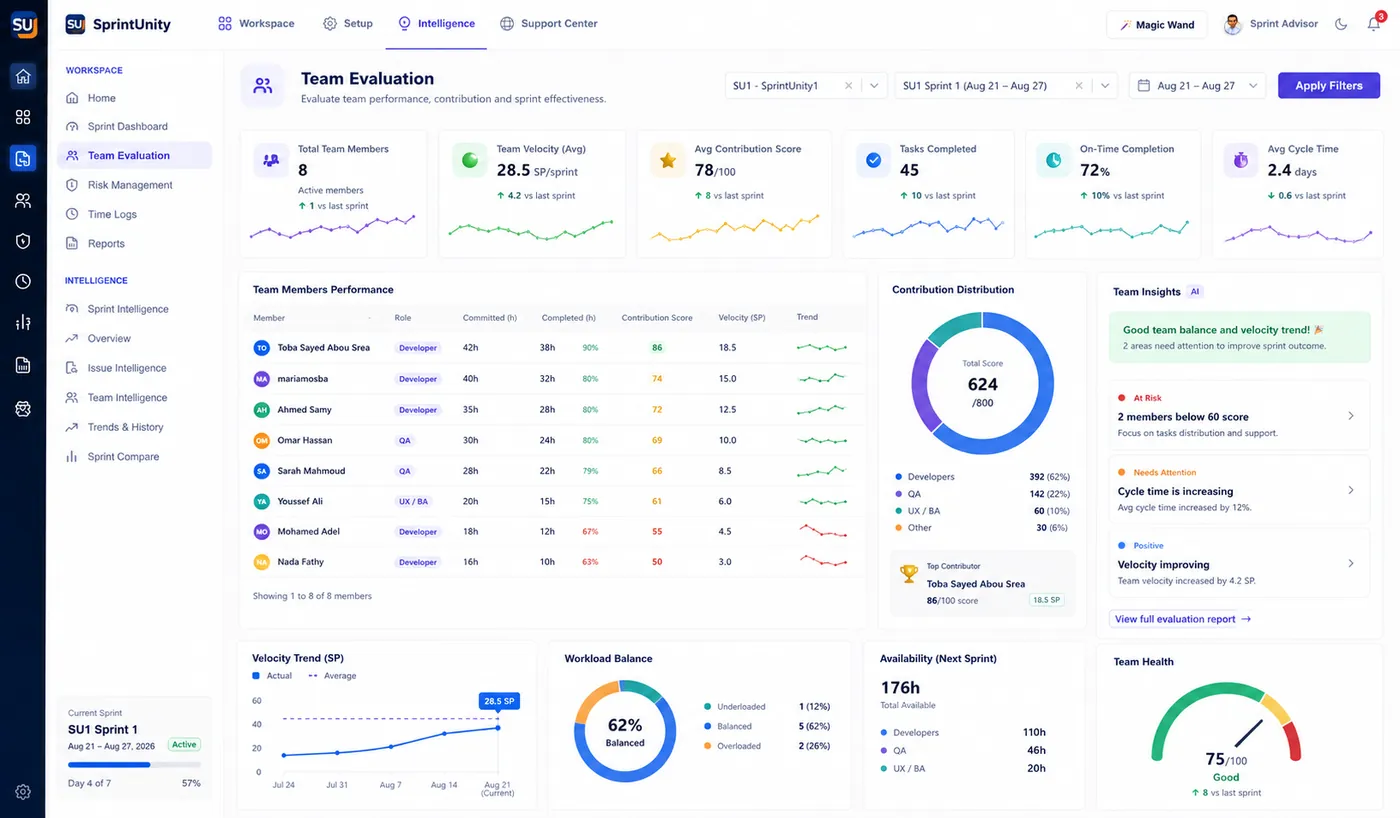
Evaluation Members — who gets evaluated, and by whom
Found under Setup → Team Evaluation → Evaluation Members (EvaluationMembers.View). Pick a project to load its Jira members, then set 3 things per person: their Evaluation Role (one of the 9 role codes), Seniority (Junior, Mid-Level, Senior, Principal, or Architect), and a specific Evaluator — the actual person responsible for scoring them each period, distinct from the generic "Evaluator Role" label set in the wizard.
Click-to-edit rows
Each row edits in place — Seniority and Evaluator are dropdowns while editing, plain text otherwise. Requires EvaluationMembers.Edit, checked tenant-wide (member profiles aren't scoped to a project).
Active / Suspended tabs, search, and filters
Filter by configuration status (Configured / Not Configured) and by Team Management team, search by name, paginate, and export the whole list to CSV.
The Statistics side panel
A live breakdown: Membership Overview (Configured vs. Not Configured donut), By Evaluation Role (a ranked bar per role with count and %), and By Role Type (Admin-tier roles vs. Normal roles, since 4 of the 9 role codes are classified as admin-type internally).
Running a period — the Evaluation Summary tab
Found under Workspace → Team Evaluation → Evaluation Summary (Evaluation.View). Pick a project and a role, then Start Evaluation — this creates an evaluation row for every configured member of that role who doesn't already have one for the current period, using the cycle length from Step 1. Navigate Prev/Next through past periods (each jump moves by exactly one cycle length).
5 KPI cards
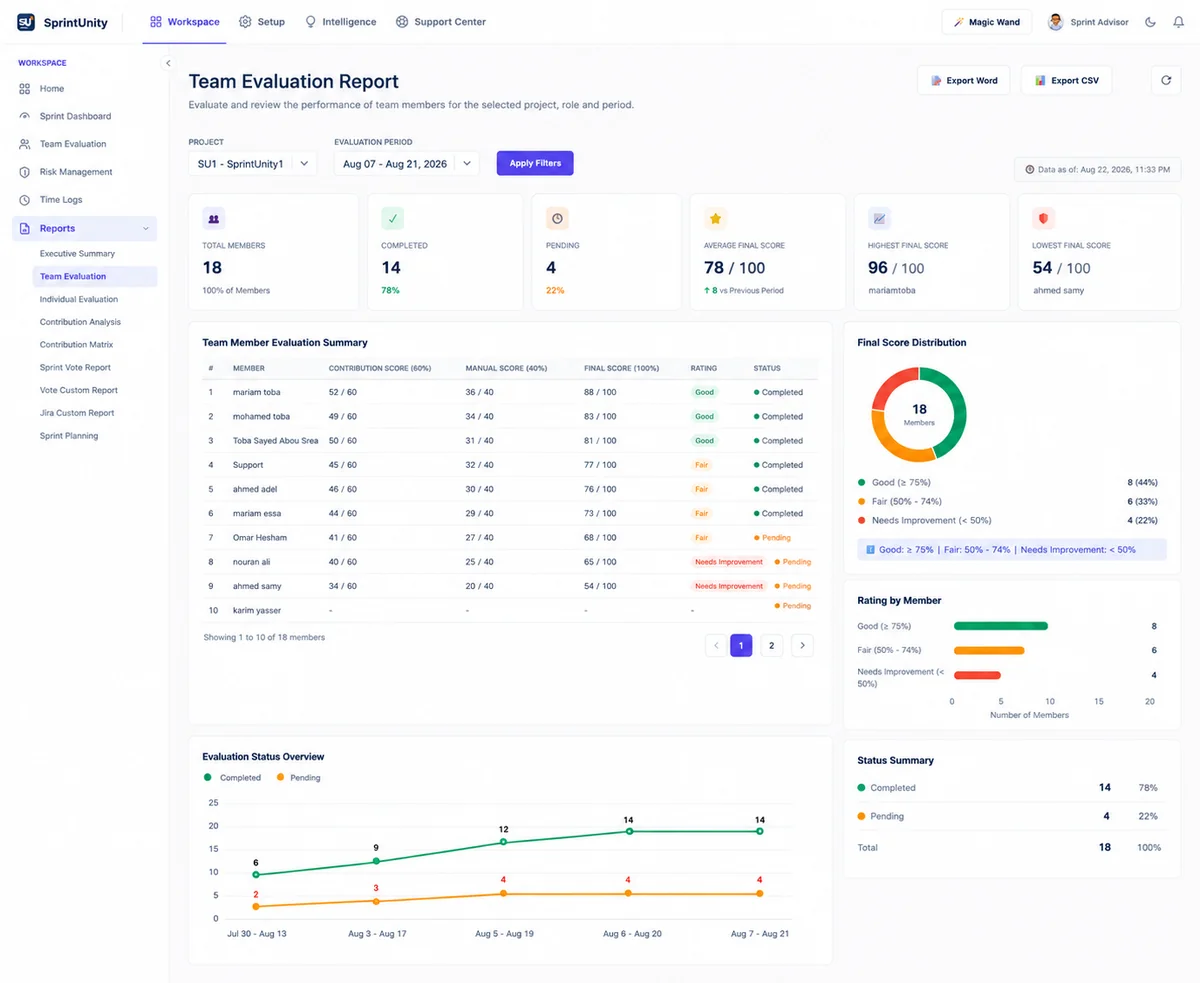
Total Team Members; Final Score (Avg) with a Good/Fair/Needs Improvement band badge and a sparkline of recent periods; Completed, In Progress, and Pending counts, each with a percentage and progress bar.
The member table
One row per person: Contribution Score and Manual Score as small percentage rings, Final Score with its band label, a status badge, a progress note, and an Evaluate button that opens the 3-step scoring flow (or View once the period is locked).
Score Distribution, Score Trend, Issue Type Breakdown
A donut of Completed/In Progress/Pending; a line chart of average Final Score across past periods (needs at least 2 completed periods to render); and a live breakdown of which issue types this role's members actually touched during the period.
Period lifecycle: Open → Ended → (optionally) Reopened
A status bar shows whether the period is open or ended. End Evaluation (Evaluation.EndPeriod) locks every member's evaluation in that period so nothing can be edited. Reopen Evaluation (Evaluation.ReopenPeriod) unlocks it again.
An Export Report button downloads the current table (member, role, all 3 scores, status) as CSV.
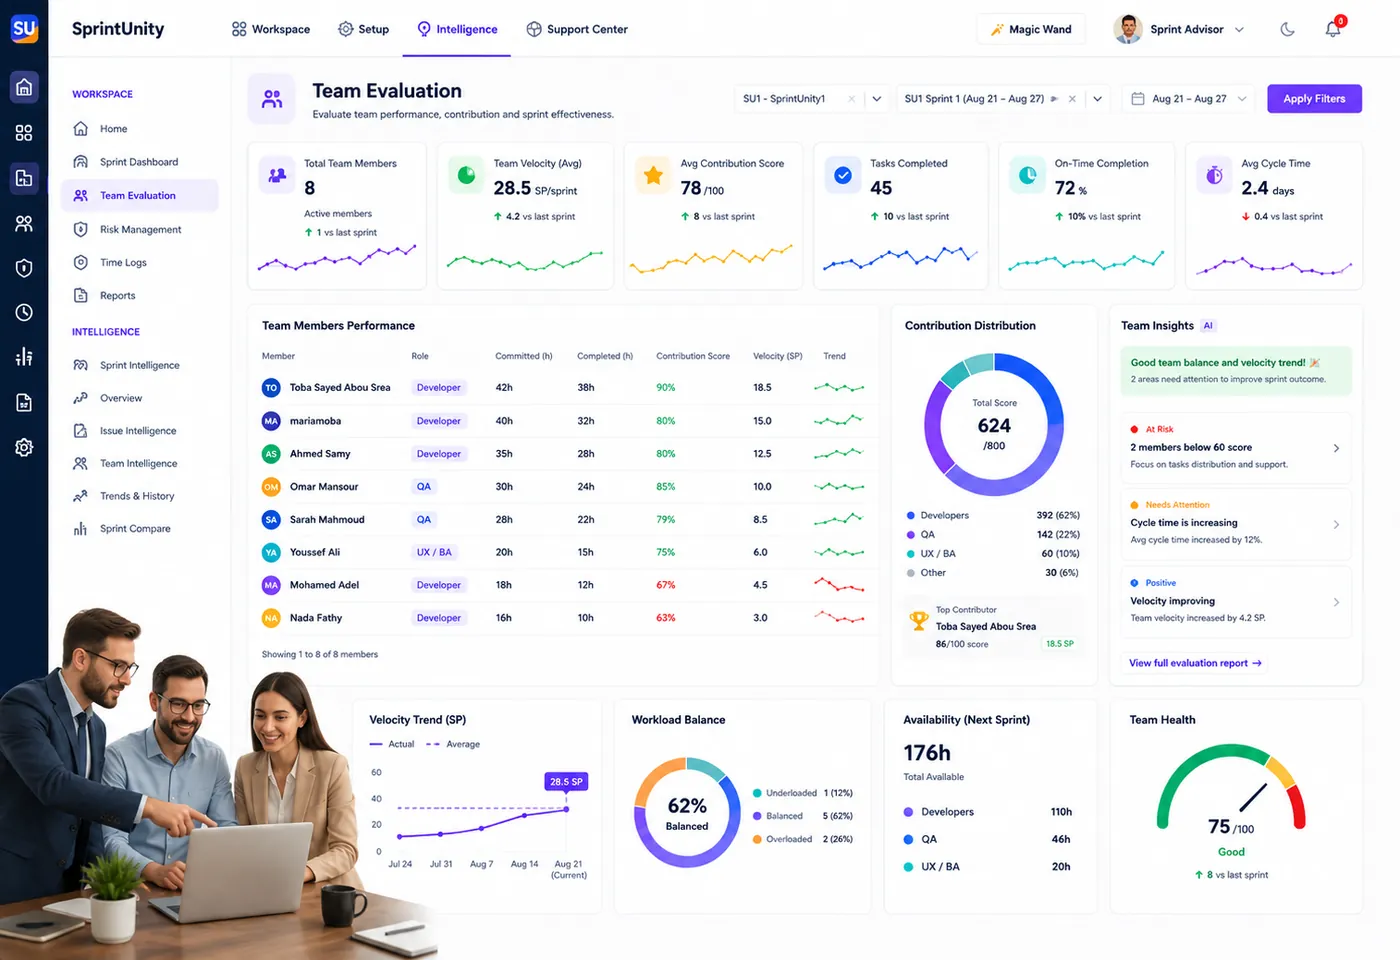
Scoring one person — the 3-step evaluate flow
Clicking Evaluate on a member opens a focused 3-step panel:
Step 1 — Manual Evaluation
A slider per enabled criterion (0–100), each row showing its weight and its live weighted contribution (score × weight ÷ 100). A running Total Manual Score and Total Weight update as you move sliders.
Step 2 — Contribution Automatic Evaluation
Fetch Contribution Data pulls this specific member's real Jira activity for the period — issues where they were creator, reporter, or current assignee, counted per issue type using whichever interactions and issue types Step 3 of the setup wizard included. It shows a Primary Contribution Type and total interaction count as context.
Step 3 — Final Member Report
Three cards — Contribution Score, Manual Score, and Final Score with its band badge — plus an optional evaluator notes field (up to 1,000 characters). Save Draft (Evaluation.SaveDraft) keeps the evaluation editable as IN_PROGRESS; Submit Evaluation (Evaluation.Submit) locks it as COMPLETED — a submitted evaluation can't be edited again unless the whole period is reopened.
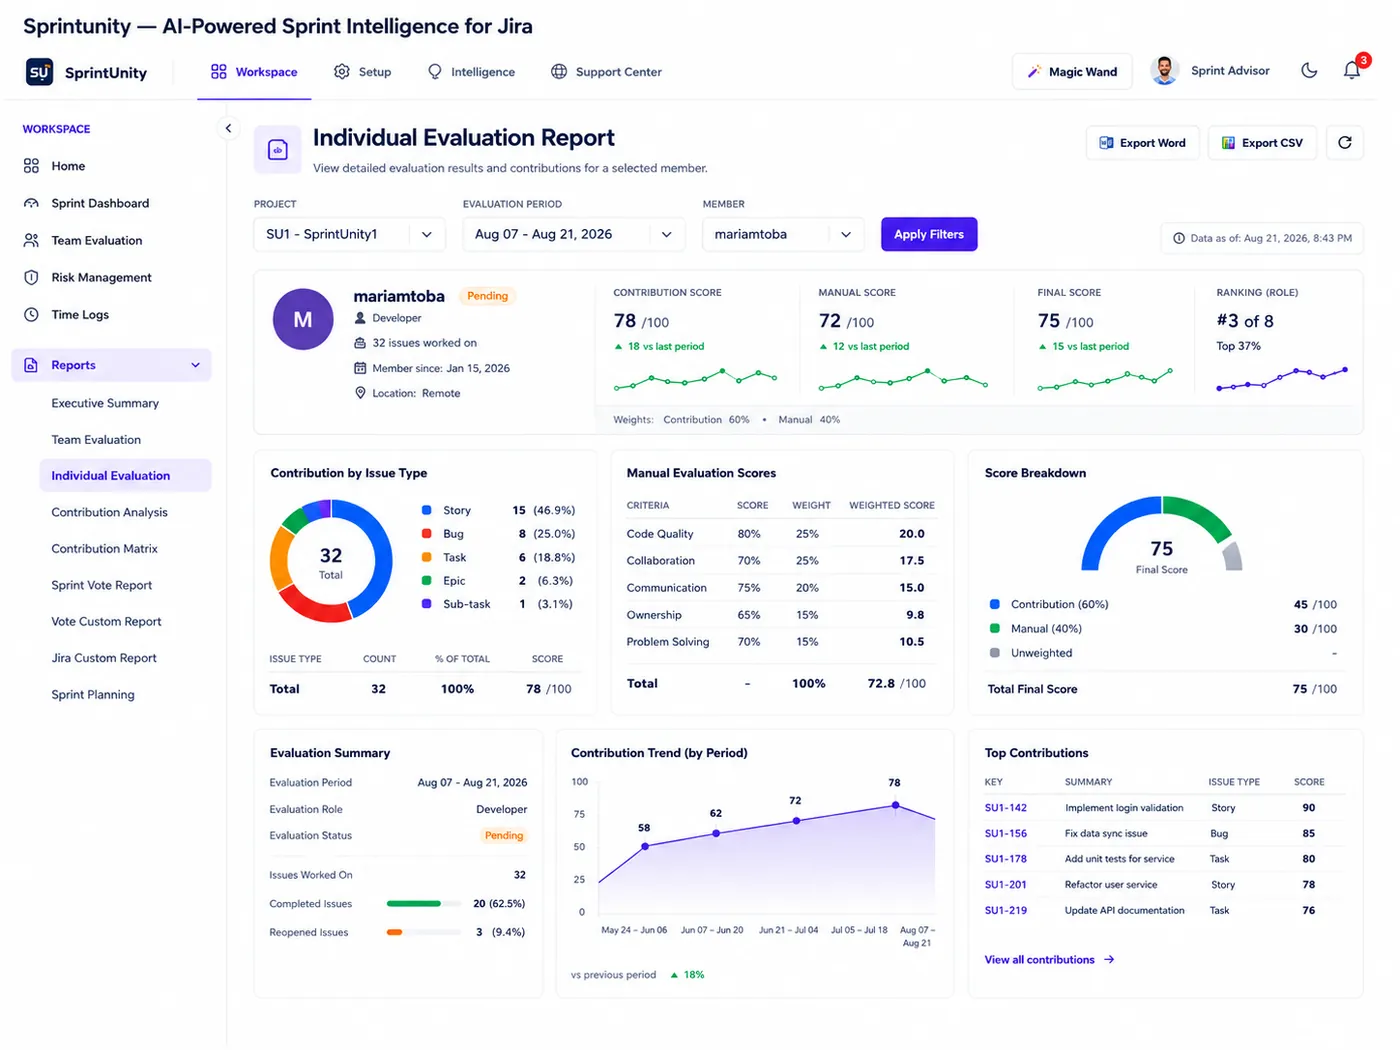
Contribution Statistics — the team-wide picture
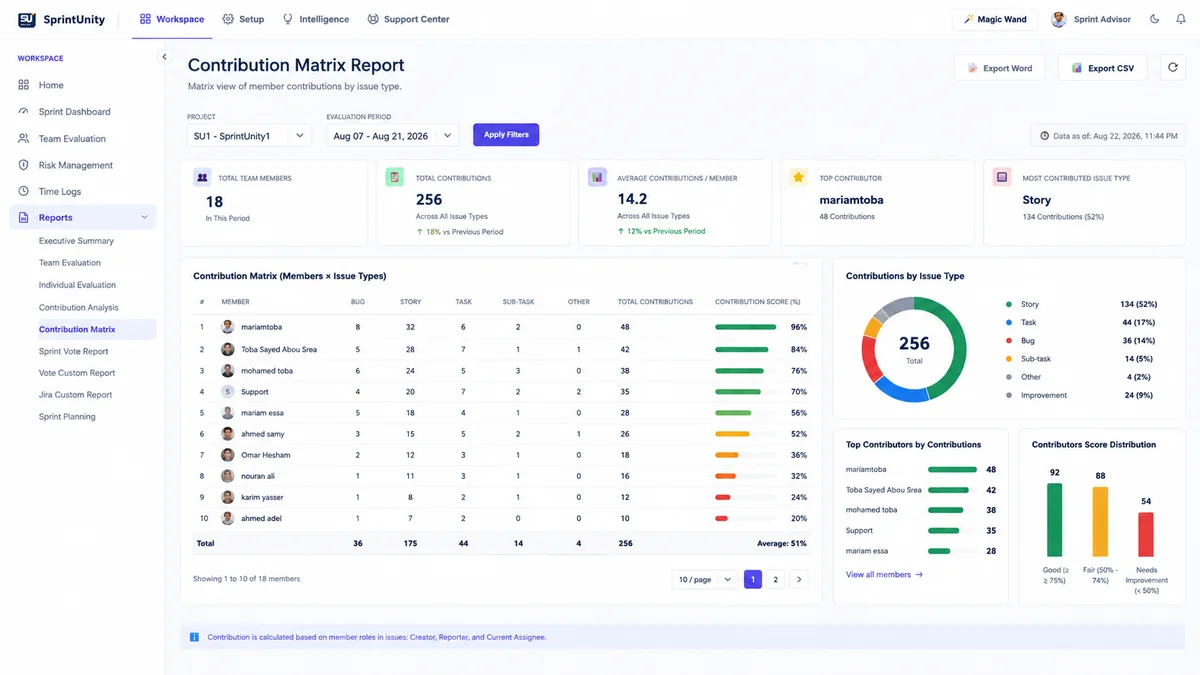
Found under Workspace → Team Evaluation → Contribution Statistics. Where the Evaluate flow fetches one member's activity, this tab fetches the whole team's at once: a matrix of interaction counts per member × issue type, a member drill-down, and a toggle to view the matrix as raw counts or as percentages. It's read-only reference data — it doesn't write anyone's Contribution Score, it's simply the same underlying Jira activity presented at a team level instead of a per-person level.
Evaluation History — every past period, one place
Shared by both hubs (EvaluationHistory.View). Pick a project and role to list past periods with average Final/Contribution/Manual Score, filterable by status and by score band (Good ≥75%, Fair 50–74%, Low <50%). Each row has a menu: Reopen Evaluation, Close Evaluation, Start Evaluation, View Details, and Export Word Report — a formatted .docx built directly from that period's real results, not a generic template.
The calculations behind every number
Manual Score
manualScore = Σ (criterionScore × criterionWeight ÷ 100), summed over every enabled criterion for that role. If weights sum to 100% (as they should), this naturally lands between 0 and 100.
Final Score
finalScore = (contributionScore × ratio + manualScore × (100 − ratio)) ÷ 100 — where ratio is that role's configured Contribution Ratio from Step 2 of the wizard (defaulting to 50 if a role was never explicitly configured).
Score bands
The same 3 bands are used everywhere a score is shown — the scoring panel, the member table, and Evaluation History: ≥ 75% = Good, 50–74% = Fair, < 50% = Needs Improvement / Low.
Team averages
The KPI "Final Score (Avg)" and the Score Trend chart only average members whose evaluation is COMPLETED for that period — pending or in-progress rows are excluded so an unfinished cycle can't drag the average down artificially.
Every one of these formulas reads from the exact same stored fields — contribution_score, manual_score, final_score, and each role's contribution_ratio — whether you're looking at the scoring panel, the member table, the CSV export, or the Word report. One calculation, reused everywhere it's shown.
| Permission | What it controls |
|---|---|
Evaluation.View | Open the Evaluation Summary tab and see scores for a project/role/period |
Evaluation.SaveDraft | Save an in-progress evaluation without submitting it |
Evaluation.Submit | Submit and lock a member's evaluation |
Evaluation.EndPeriod | End an evaluation period, locking every member's row in it |
Evaluation.ReopenPeriod | Reopen an ended period so evaluations can be edited again |
EvaluationSetup.View | See the Evaluation Setup wizard |
EvaluationSetup.Edit | Change the evaluation cycle length, roles, or automatic contribution settings |
EvaluationSetup.EditCriteria | Add or edit manual criteria for a role |
EvaluationSetup.DeleteCriteria | Remove a manual criterion from a role |
EvaluationMembers.View | See the Evaluation Members list |
EvaluationMembers.Edit | Assign a member's evaluation role, seniority, and evaluator |
EvaluationHistory.View | See and export past evaluation periods |
12 permissions in total, split cleanly across configuration (EvaluationSetup.*, EvaluationMembers.*), running periods (Evaluation.*), and reviewing the past (EvaluationHistory.View) — so an org can, for example, let team leads score people (Evaluation.Submit) without also giving them the ability to redefine the criteria everyone is scored against (EvaluationSetup.EditCriteria).
Magic Wand — a deterministic explainer on almost every panel
Every step of the setup wizard, and every card on the Evaluation Summary tab, is individually selectable with Magic Wand — click a panel while it's armed and get a structured explanation of just that panel's own data, not the whole page. Same rule-based, no-LLM approach used everywhere else in the app:
Setup wizard — 5 panels
One explainer per step (Evaluation Period, Roles & Evaluators, Automatic Contribution, Manual Criteria, Review & Save), each reading only that step's current configuration.
Evaluation Summary — 5 panels
KPI Summary, Team Member Scores, Score Distribution, Score Trend, and Issue Type Breakdown each explain themselves independently.
Evaluation Members & Evaluation History — 1 panel each
A single page-level explainer summarizing configuration coverage or the loaded history, since neither page has the wizard's or summary tab's multi-panel layout.
Ask Sprint Advisor about this
Beyond the universal "Explain this page" (works on every evaluation screen, no permission required), Team Evaluation has its own real chat skills:
"Show evaluation weighting for each role"
Gated by Evaluation.View. Tenant-wide — no project or period needed. Reports each role's real Contribution/Manual split and its enabled criteria weights, straight from the same table the wizard edits.
"Explain this step"
Available only inside the Evaluation Setup wizard — explains whichever of the 5 steps you're currently on.
"Summarize evaluation members"
Gated by EvaluationMembers.View. A tenant-wide breakdown of member profiles by role, plus how many are missing an assigned evaluator — the exact condition that blocks their scoring once a period opens.
"Summarize evaluation history"
Gated by EvaluationHistory.View. Needs a project and role selected on the History screen first — reads the same history rows the page itself displays.
See AI Sprint Assistant for how Sprint Advisor and Magic Wand work together across the rest of the app.
Two honest gaps worth knowing about
It doesn't reach into the Jira issue panel
Unlike Sprint Capacity or Issue DOR, Team Evaluation has no presence inside hello-world — no card on the issue panel shows anyone's evaluation status. It's entirely a dashboard feature, run from Setup and Workspace.
"Automatic" contribution still needs a human number
As covered above: only 3 of the 7 possible interaction types are actually counted today (Created, Reporter, Assignee), and even then, the fetched counts inform the evaluator rather than filling in the score for them. Treat Contribution Score as evaluator-entered-with-real-data-in-front-of-them, not machine-calculated.
Some marketing material describes "AI-generated insights" for Team Evaluation. Nothing in the actual Evaluation Summary, Contribution Statistics, or Evaluation History code generates free-form insight text — what's really there are the KPI cards, donut/trend charts, and Magic Wand's deterministic, rule-based explainers described above. No LLM or external AI call is involved anywhere in this feature.
Setting it up to get good results
A practical order that avoids the two most common gaps (unconfigured members, and criteria nobody agreed on):
1. Run the Evaluation Setup wizard once
Pick a cycle length the team will actually keep up with — 2 weeks is the recommended default. Set each role's Contribution/Manual ratio deliberately; don't leave every role at the 50/50 default if, say, QA's manual review should count for more than raw ticket counts.
2. Load or customize criteria per role
Start from "Load Standard Criteria," then adjust wording or weights to match how your org actually talks about performance — the weights just need to sum to 100% per role.
3. Configure every member in Evaluation Members
This is the step most likely to get skipped — and the one that silently drops people from evaluation periods. Assign role, seniority, and a real evaluator for everyone before the first period starts.
4. Start the period, then actually fetch contribution data before scoring
Don't skip Step 2 of the scoring flow — pulling real numbers first makes the Contribution Score an informed judgment instead of a guess.
5. End the period when everyone's submitted
Ending locks the record, which is what makes Evaluation History and the Score Trend chart meaningful — trend data only accumulates from periods that were properly closed out.
What comparing evaluations over time is actually for, and who benefits
The point isn't a single score — it's a repeatable, defensible record that holds up across a whole team, a whole quarter, or a whole org. A few concrete ways different people get value:
Rating this page
Anyone reading this documentation can mark whether it answered their question — no permission required. It only helps the SprintUnity team see which pages need more detail.