Sprint Dashboard
The Sprint Dashboard is where you land every time you open SprintUnity — and it's actually two related screens, not one. This page explains exactly what each shows, where every number on them comes from, and where to go next.
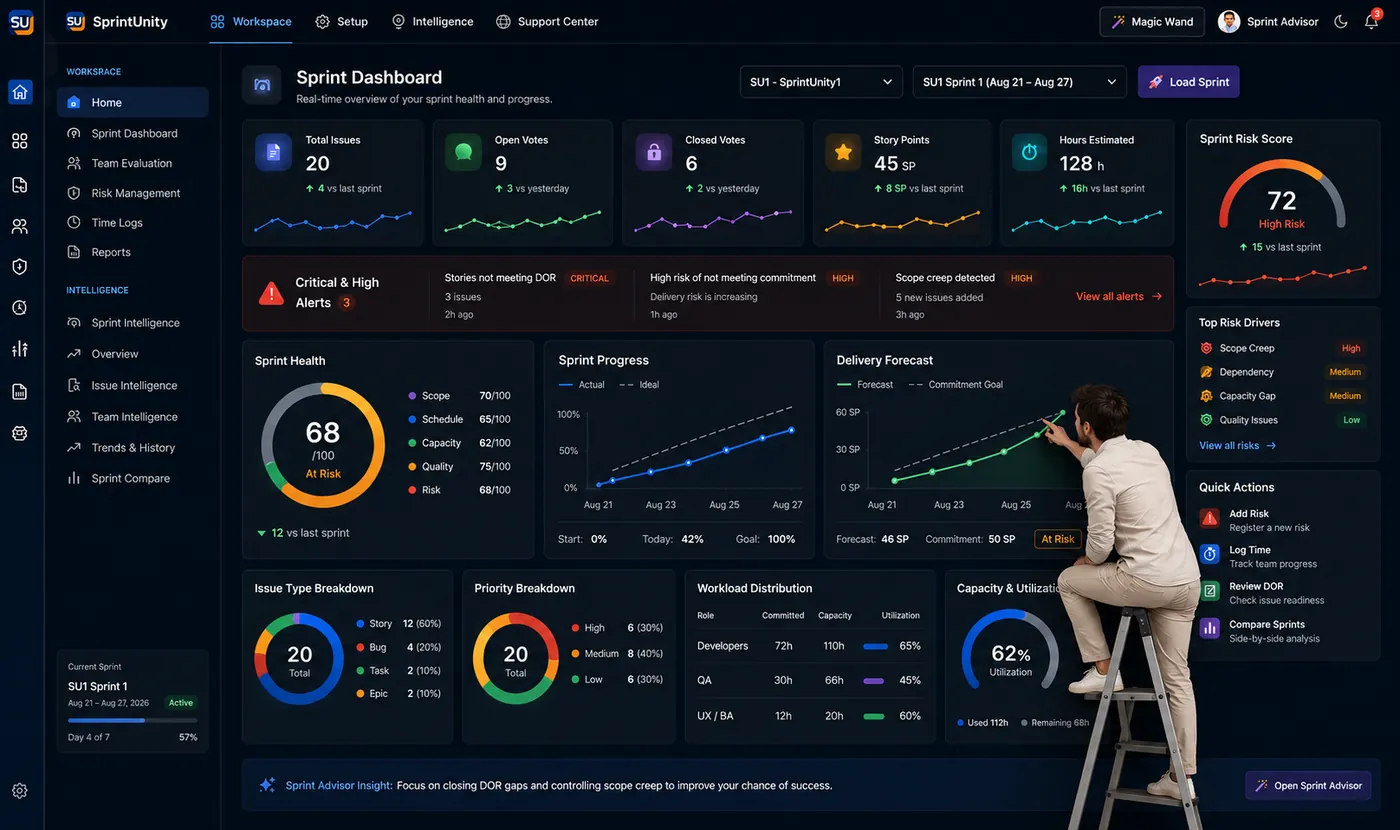
Reading the screen
If this is your first time here, this is what each part of the Dashboard is doing for you and why it's worth checking daily, not just at planning or retro:
Score tiles (Health, Risk, Capacity)
Each tile is one already-computed score, not a live recalculation on page load — so what you see matches exactly what Reports and Advisor will tell you too. Benefit: one glance tells you whether today needs your attention.
Issue list
Every issue currently in the sprint, with its status. This is pulled directly from Jira, so it's never out of sync with your board. Benefit: no separate tool to check for "what's actually in this sprint."
Vote status
How many backlog items still need a team estimate vs. how many are settled. Benefit: tells you whether it's safe to start work or estimation is still open.
Capacity bar
Logged Dev/QA hours plotted against the sprint's configured limits. Benefit: flags over-commitment while there's still time to rebalance, instead of finding out at 90% through the sprint.
Home — the tenant-wide rollup
Home is the landing view across every project and sprint your tenant has data for. It's built specifically for the question "where should I be paying attention across everything we're running right now?"
Every sprint's health is shown using the same shared classification logic (levelForScore) that each sprint's own Risk page uses — this is deliberate: Home's numbers can never quietly drift from what you'd see if you opened any individual sprint's detail page. What you see on Home is a true rollup, not a separate summary calculation. Benefit: a Delivery Manager watching 10 teams doesn't have to open 10 sprints to find the one that needs help.
Dashboard — the sprint-scoped working view
Once you open a specific sprint, you're in the sprint-scoped Dashboard — the page a team actually works from day to day. At a glance it shows:
Current issues
What's in the sprint right now, and their state.
Vote status
Where story-point voting stands for this sprint's backlog items.
Capacity
How logged hours compare to the sprint's configured Dev/QA capacity limits.
The scores you'll see — and the calculation behind each
Both Home and the sprint Dashboard surface the same underlying intelligence scores. Nothing here is a black box — here is exactly what's behind each number:
Sprint Health Score — 0 to 100
Calculation: five pillars, each scored 0–100 independently, then blended by weight (chart below). Benefit to you: instead of five separate reports, one number tells you if the sprint needs attention — the chart tells you which pillar to fix first.
How to read this: these are the exact weights the Health Score formula uses. Schedule and Risk together make up 45% of the score — so if your Health Score drops, checking those two pillars first will usually tell you why, before you dig into Scope, Capacity, or Quality.
Sprint Risk Score — 0 to 100
Calculation: severity points from every open or monitoring risk on the sprint, summed and normalized. Benefit: documented explicitly as an indicative management signal, not a statistical probability — so you use it to prioritize which risk to act on first, not to predict a failure percentage.
Team Health Score — 0 to 100
Calculation: same scale as Sprint Health, scoped to a team's overall performance across sprints. Banded: 90+ Excellent, 80+ Healthy, 70+ Watch, 60+ At Risk, below that Critical. Benefit: separates "this one sprint had a bad week" from "this team consistently needs support."
Delivery Forecast & Confidence
Calculation: Forecast blends this sprint's in-sprint velocity with the team's historical average, weighted more toward history early in the sprint and more toward live velocity as it progresses. Confidence is a separate 0–100 evidence-based blend. Benefit: tells you not just "will we finish" but how much to trust that answer this early in the sprint.
Full formulas for each of these live under Sprint Intelligence & Health in the sidebar if you want the exact math.
Who can see what
Visibility on Home and the Dashboard follows the role your admin assigned you — everyone doesn't automatically see every team's numbers. Roles, permission grants, and per-user overrides are configured under Role-Based Access Control, with a full activity trail of who changed what.
Rating this page
Anyone reading this documentation — no special permission required — can mark whether a page answered their question. Your click doesn't change what you can see or do in the app; it only helps the SprintUnity team see which pages need more detail, so the benefit is entirely to future readers (including future you).
Where to go next from here
Reports
Nine report types live in the Reports Hub: Executive Summary, Team Evaluation, Individual Evaluation, Contribution Analysis, Contribution Matrix, Sprint Vote, Sprint Planning, Custom Report, and Jira Custom Report. Executive Summary is the most data-dense — it composes Sprint Intelligence, Team Intelligence, Risk, Capacity, and Voting data into a single page.
Overview
A supporting summary surface built on the same intelligence data as Home, for a different angle on the same numbers.
Recommendations
A separate suggestion surface that turns the same underlying signals into concrete next actions.